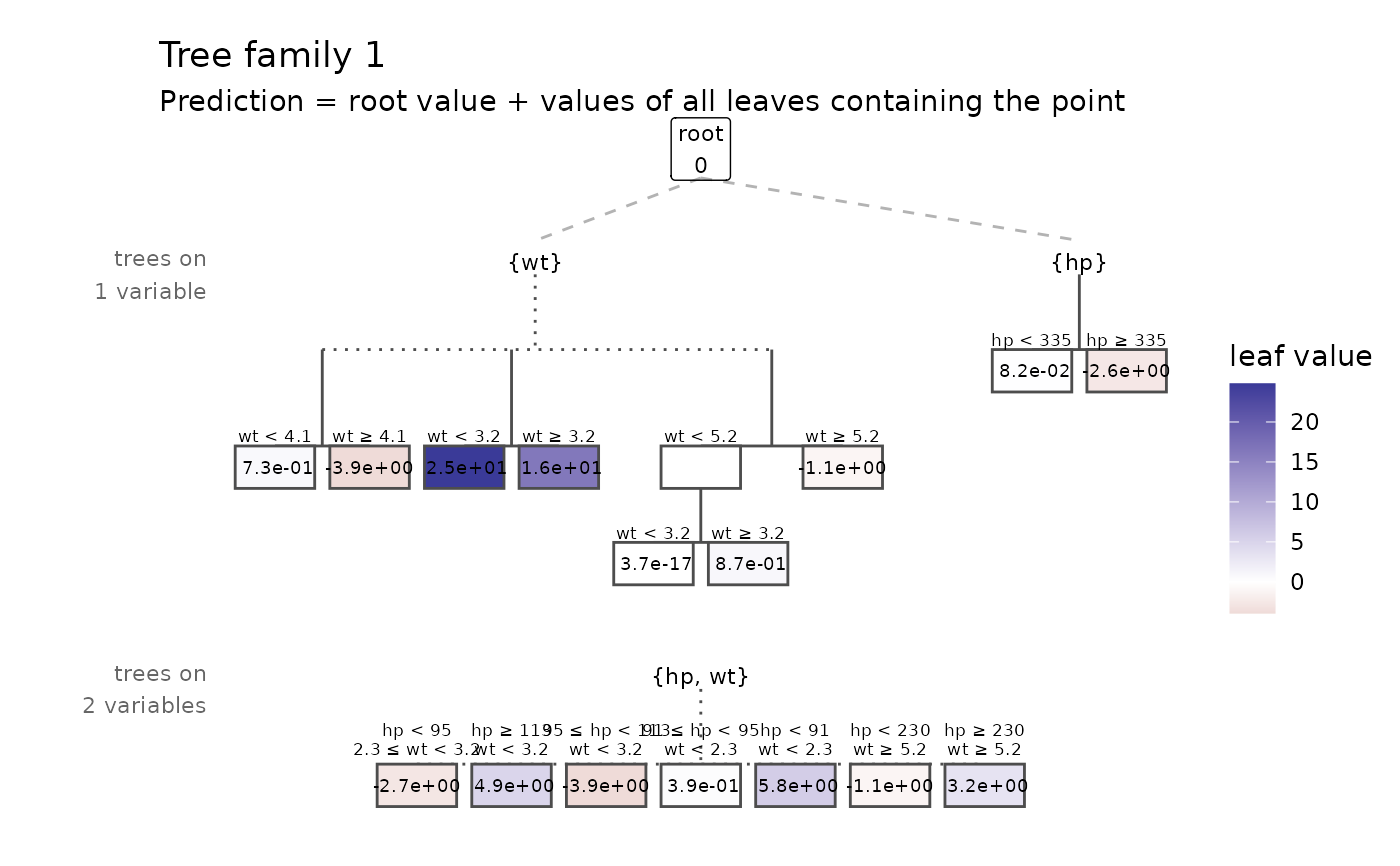
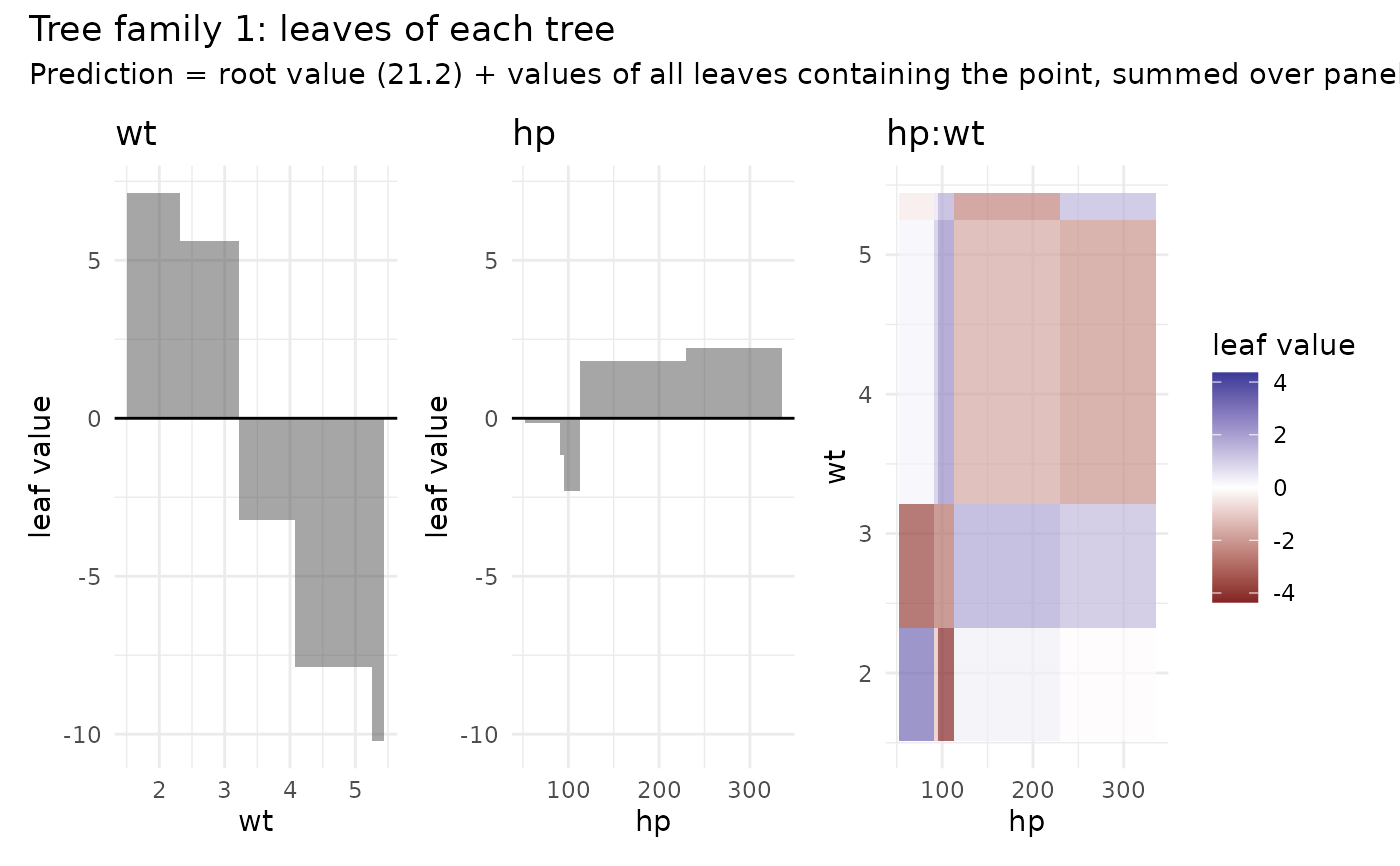
Illustrates how a Random Planted Forest predicts by drawing the trees of one tree family. Each tree belongs to a set of variables, and its leaves are boxes in those variables with a value each. The prediction for a point is the root value plus the values of all leaves containing it, averaged over tree families.
Arguments
- x
[rpf]: A fittedrpfmodel.- family
[integer(1): 1]: Which tree family to extract, between 1 andn_families.- ...
Reserved for future expansion.
- type
[character(1): "tree"]:"tree"for a split diagram,"boxes"for the leaves in variable space.- max_interaction
[integer(1): 2]: Draw trees on up to this many variables, at most 2 fortype = "boxes". The remaining trees are summarized.- trees
[character | NULL: NULL]: Names of the trees to draw, as in thetreecolumn ofrpf_boxes(), e.g.c("x1", "x1:x2").NULLdraws all trees up tomax_interaction.- class
[character(1) | NULL: NULL]: For multiclass classification, the outcome level whose values to plot.NULLuses the first level.- factor_levels
[logical(1): TRUE]: Label factors with their levels instead of integer codes. Levels are in the order used in the fit: ordered by the outcome, or in their own order withkeep_level_order(seerpf()).
Details
type = "tree"draws a split diagram in the style of Figure 1b of Hiabu et al. (2020), with the trees in rows by number of variables, each leaf filled by its value. The forest stores only its final leaves, not the order of splits or which leaf a tree grew from, so the splits within a tree are reconstructed: the diagram shows a split structure consistent with the leaves, and dashed lines link trees to the trees they could have grown from. Leaves that overlap other leaves of the same tree hang from dotted lines. Readable for small fits, e.g.n_families = 1andn_splits = 10.type = "boxes"draws one panel per tree in variable space: leaves of trees on one variable as bars from zero to their value, leaves of trees on two variables as rectangles filled by their value. Overlapping leaves add up, which the translucent drawing shows.
Trees on more than max_interaction variables, and trees not in trees,
are not drawn but summarized as a remainder, similar to the remainder term
of predict_components().
After purify(), the trees are the components of the functional
decomposition and only type = "boxes" applies. To plot components
averaged over all tree families, use predict_components(), e.g. with the
plotting functions in glex.